
Question:
Can hydrogen have an effect on CO readings, and can downloading the data help determine what’s going on?
Answer:
The attached .txt file is a very cool data download from a G460 instrument (the file is posted at the following link: 06262015.txt ). The readings are from an instrument that belongs to Robert Lindley, the Eastern Zone Manager for GfG. Robert was in his garage, getting ready to calibrate his instruments prior to leaving on a business trip for GfG. When he turned his G460 on he was shocked to see high readings for carbon monoxide. He left the garage, opened the garage door from the outside, and did not re-enter until the readings returned to fresh air values. The response of the instrument provides a good example of conditions that can affect readings, and how to interpret the results. The data-logging interval is set to 1.0 minute, which means our “G450 / G460 Data Viewer Software” is perfect for looking at the results.
What caused the readings?
Robert has a golf cart with a faulty battery charger. Instead of the charger shutting down or going into trickle when the battery finished charging, it was continuing to pump power into the battery at the full charging rate.
During charging, (especially in the event of overcharging), lead acid batteries produce oxygen and hydrogen. These gases are produced by the electrolysis of water from the aqueous solution of sulfuric acid. Since the water is lost, the electrolyte can be depleted. This is why you need to add water to non-sealed lead acid batteries. When a lead acid battery cell “blows” or becomes incapable of being charged properly, the amount of hydrogen produced can increase catastrophically.
Hydrogen is not toxic, but at high concentrations is a highly explosive gas. The 100% LEL concentration for hydrogen is 4.0% by volume. At this concentration, all it takes is a source of ignition to cause an explosion. Sparking from a battery terminal as it is connected or disconnected from the charging system is more than adequate as a source of ignition energy. That’s why lead acid batteries should only be charged in well ventilated areas.
Why did the hydrogen have an effect on the CO readings?
This is the chemical reaction that is used in electrochemical CO sensors to detect gas:
CO Sensing Electrode Reaction: 2CO + 2H2O → 2CO2 + 4H+ + 4e–
CO Counter Electrode Reaction: O2 + 4H+ + 4e– → 2H2O
In the first part of the detection reaction, the sensor consumes water from the electrolyte (the solution in the sensor) and generates hydrogen (H+). In the second part of the reaction, the hydrogen reacts with oxygen in the electrolyte to produce water. Because the CO detection reaction includes hydrogen, it’s easy for hydrogen in the ambient air to have an effect on readings.
At GfG we use CO sensors that are deliberately designed to limit the response to hydrogen. However, they still show at least some response.
The following chart shows the response of a substance-specific, electrochemical hydrogen sensor to 1,000 ppm hydrogen calibration gas (the green colored response curve). The readings of the H2 sensor are very accurate when the sensor is exposed to gas.
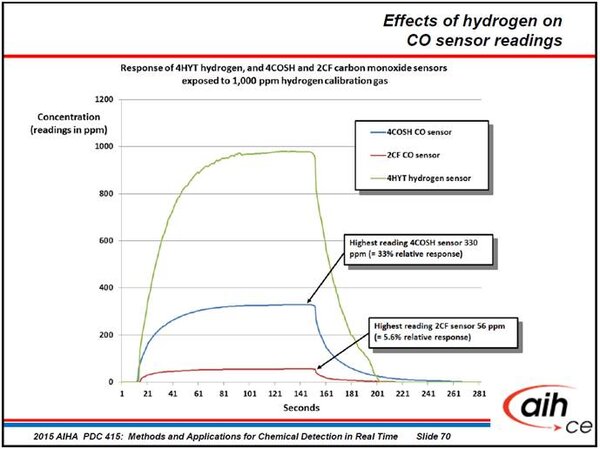
The blue colored line shows the response of the CO channel of a COSH sensor to the same 1,000 ppm hydrogen gas. COSH sensors simultaneously measure both CO and H2S. We use the “two-in-one” COSH sensor whenever we need to save space in the G460. Using the COSH sensor means we have another sensor position available to measure a different gas.
COSH sensors have one sensing electrode for H2S, and a separate sensing electrode for CO. The sensor is split into two chambers. H2S is measured in the outer chamber, and CO is measured in the inner chamber. The sensor is designed for the rapid diffusion of atmosphere that contains CO into the inner chamber. The CO channel of the COSH sensor has a relative response to hydrogen of about 33%. As you can see, when we exposed the COSH sensor to 1,000 ppm hydrogen, it produced a reading of 330 ppm on the CO channel.
We only use the COSH sensor when we need to save space. When we don’t need to save space, we use a single-channel CO sensor that is specifically designed to have the lowest possible response to hydrogen. The single-channel “hydrogen nulled” CO sensor is the standard sensor we use in all 4-gas G450 instruments. Even though the sensor is designed to show the lowest possible response, it still shows a relative response to hydrogen of 56 ppm (= 5.6 %).
Robert’s results:
“Session 5” started when Robert turned the instrument at 8:28 AM on June 26, 2015. The session ended when he turned the instrument back off at 10:18 PM on the same date. In the following set of graphs, the actual CO readings are shown in blue, the 15-minute STEL calculation is shown in black, and the 8 –hour TWA calculation is shown in green. The software lets you view or hide each of the graphs by clicking on the legend for the graph at the bottom of the screen.
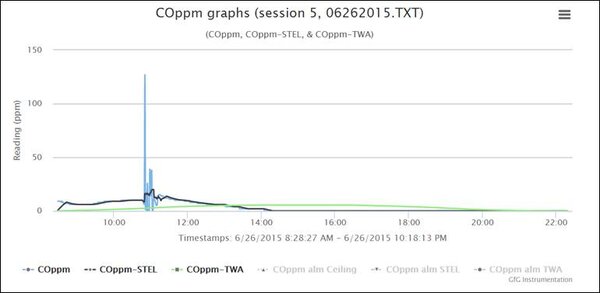
Let’s start by hiding the STEL graph.
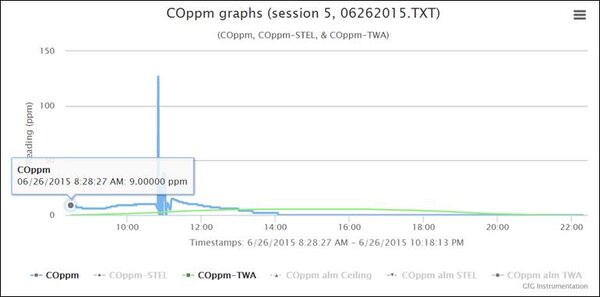
When you look at the real-time CO readings, the concentration was well above 0 ppm from the moment Robert turned the instrument on. But at 10:50 AM something really interesting happened. Robert had been moving the instrument around the garage, trying to find the source of the CO readings. You can see the concentration at any given moment by moving the cursor over the graph to the point of interest.
At 10:50 AM Robert positioned the instrument close to the lead acid battery in the golf cart, and the readings immediately climbed to 127 ppm. Given that the CO channel of the COSH sensor has a relative response to hydrogen of about 33%, the true concentration of hydrogen in Robert’s garage where the instrument was located at 10:50 AM was about 100/0.33 ≈ 300 ppm H2.
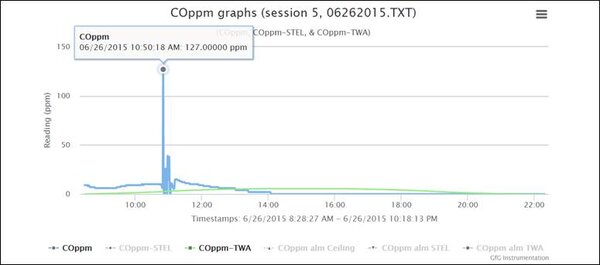
The readings rapidly went up and down when Robert moved the instrument back and forth near the battery. Because hydrogen is actually part of the electrochemical CO sensor detection reaction, the sensor responds and recovers very quickly. This is different than the response of the sensor to other gases (such as acetylene) that can interfere with CO sensor readings. It can take hours for the sensor to recover after exposure to acetylene. In the case of hydrogen the response and recovery is very rapid, which is exactly what you see in the graph.
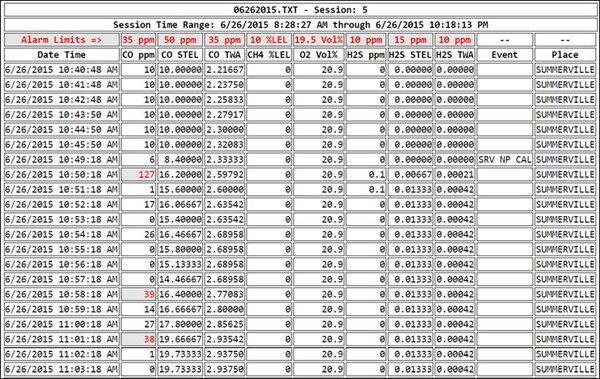
When you look at the table (instead of the graph) of the logged results for Session 5, you see something else that is very interesting. In the “Table View” of the session, any intervals where the concentration exceeds the alarm settings are flagged in red. The low (A1) alarm for CO was set at 35 ppm. The STEL alarm was set at 50 ppm, and the TWA alarm was set at 35. There are three intervals in the table (flagged in red) where the A1 alarm was exceeded. There were no intervals where the STEL or TWA alarms were exceeded.
Now for the interesting part. At the exact moment the CO reached 127 ppm, the H2S reading started to rise, reaching a concentration of 0.1 ppm.
You can also see this when you look at the H2S graph for Session 5:
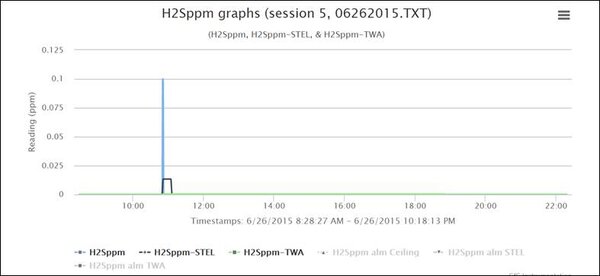
This makes perfect sense, and helps confirm that the CO readings were actually due to the presence of hydrogen. The hydrogen sulfide (H2S) channel of the COSH sensor has a very small relative response to hydrogen of about 0.03%. If the true concentration of hydrogen in the area of the instrument at 10:50 AM was about 300 ppm, you would expect the H2S channel of the COSH sensor to read about 300 x .0003 ≈ 0.09 ppm H2S. The actual reading was 0.1 ppm, which is extremely close to the expected value. Sweet!
Why didn’t the LEL sensor detect the presence of hydrogen?
Hydrogen is a flammable gas. The lower explosive limit (LEL) is the minimum concentration of gas that can explode if a source of ignition is present. The LEL concentration for hydrogen is 4.0% volume, (which is equal to 40,000 ppm).
The LEL alarm is normally set at 10.0% LEL. Assuming the instrument is properly calibrated, it would take about 4,000 ppm hydrogen to activate the LEL alarm. However, Robert’s instrument was calibrated to methane, which has a slightly different response.
Assuming the highest true concentration of hydrogen in Robert’s garage was about 300 ppm, it’s easy to see why the LEL sensor didn’t show a reading. Even if the instrument had been correctly calibrated for hydrogen, the concentration in Robert’s garage was still less than 1.0% LEL. The concentration was just too low to register on the LEL sensor.
What if I wanted to directly measure ppm hydrogen?
No worries! All you need to do is install a 0 – 2,000 ppm range, (= 0 to 5% LEL) substance-specific hydrogen sensor in your G460.
Robert’s downloaded results illustrate how useful it can be to actually look at the graphs and tabular response of the sensors over time. With a little bit of experience the shape of the curves can provide all sorts of additional critical information.
Thanks again to Robert for sending the download to my attention.
Bob Henderson
President
GfG Instrumentation, Inc.